

This chart displays how total emissions and number of active targets have changed over time for S&P500 companies. A target is considered active from its commitment year through its target year, including both endpoints, as long as it is reported in the source public documents. For this figure, we only include companies listed in the S&P500 Index in June 2023.
Corporate
Climate Targets
Project
The Corporate Climate Targets Project (CCTP) studies voluntary corporate net-zero and other types of greenhouse gas emission targets. Drawing from publicly-available sources, including corporate sustainability reports, company websites, 10-K filings, and annual reports, our research team compiled data on voluntary targets to reduce greenhouse gas (GHG) emissions and related targets reported from 2000 through 2024 for companies included on the Russell 3000 Index as of June 2023. All companies were provided the opportunity to share feedback. Indexed emissions data based on Trucost Environmental data are provided with permission by S&P Global. Six-character CUSIP identifiers are provided with permission by CUSIP Global Services (CGS).
Home
By Industry
Climate Targets by Industry
All 14 industries sorted by total target count. Includes all targets reported 2000-2024, both active and inactive as of 2024. A target is considered active from its commitment year through its target year, including both endpoints, as long as it is reported in the source public documents. A target is then considered inactive when it is past its target year and not reported in the source public documents. These industry groupings represent aggregations of two-digit NAICS codes, except for manufacturing that is divided into three categories.
SBT-Approved targets overlap with other types above
By Company
By Location
The first map below displays company headquarter locations by Metropolitan Statistical Area (MSA) within the continental United States. The shading represents the proportion of Russell 3000 Index companies in the sample headquartered in a given MSA that reported at least one climate target from 2000 through 2024. The next three maps build on the first map with binary representations of state environmental policies and strategies. The final map represents public attitudes on greenhouse gas regulation at the Congressional district level using Cooperative Election Study (CES) data. Explore below how Russell 3000 company headquarter locations are associated with adoption of climate targets and the environmental policy context.
Russell 3000 Company Headquarters by MSA, 2024
This map shows Russell 3000 company headquarters grouped by metropolitan statistical areas (MSA). Larger bubbles represent more companies headquartered in an MSA. Bubbles are shaded depending on the share of companies that reported climate targets, ranging from lightest (no companies in the MSA reported targets) to darkest (all companies in the MSA have targets).
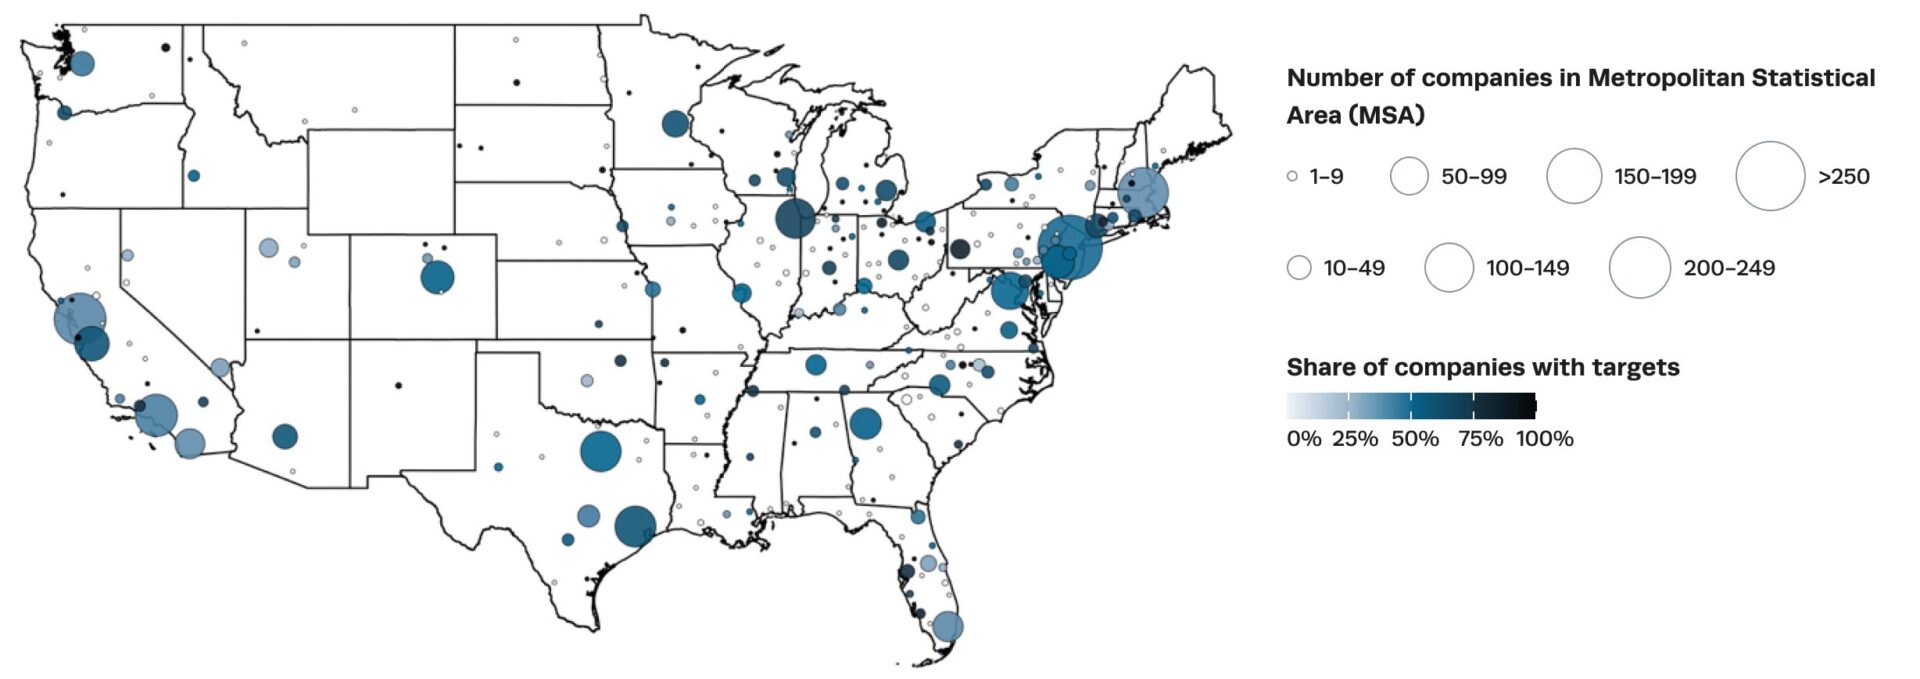
Bubbles by MSA (size = number of companies, color = share of companies with climate targets)
Source: Salata Institute Corporate Climate Targets Database, 2026.
Note: Map excludes the 120 companies with HQ locations outside the continental United States.
Russell 3000 Company Headquarters by MSA and State Carbon Pricing, 2024
This map shows Russell 3000 company headquarters grouped by metropolitan statistical areas (MSA). Larger bubbles represent more companies headquartered in an MSA. Bubbles are shaded depending on the share of companies that reported climate targets, ranging from lightest (no companies in the MSA reported targets) to darkest (all companies in the MSA have targets).
States with carbon pricing programs in 2024 are shaded; policy details vary by state.
States impose a carbon price on sources of greenhouse gas emissions through cap-and-trade programs. The emissions cap sets a fixed quantity of tradable emission allowances granting the holder the right to emit a specified amount of greenhouse gases.
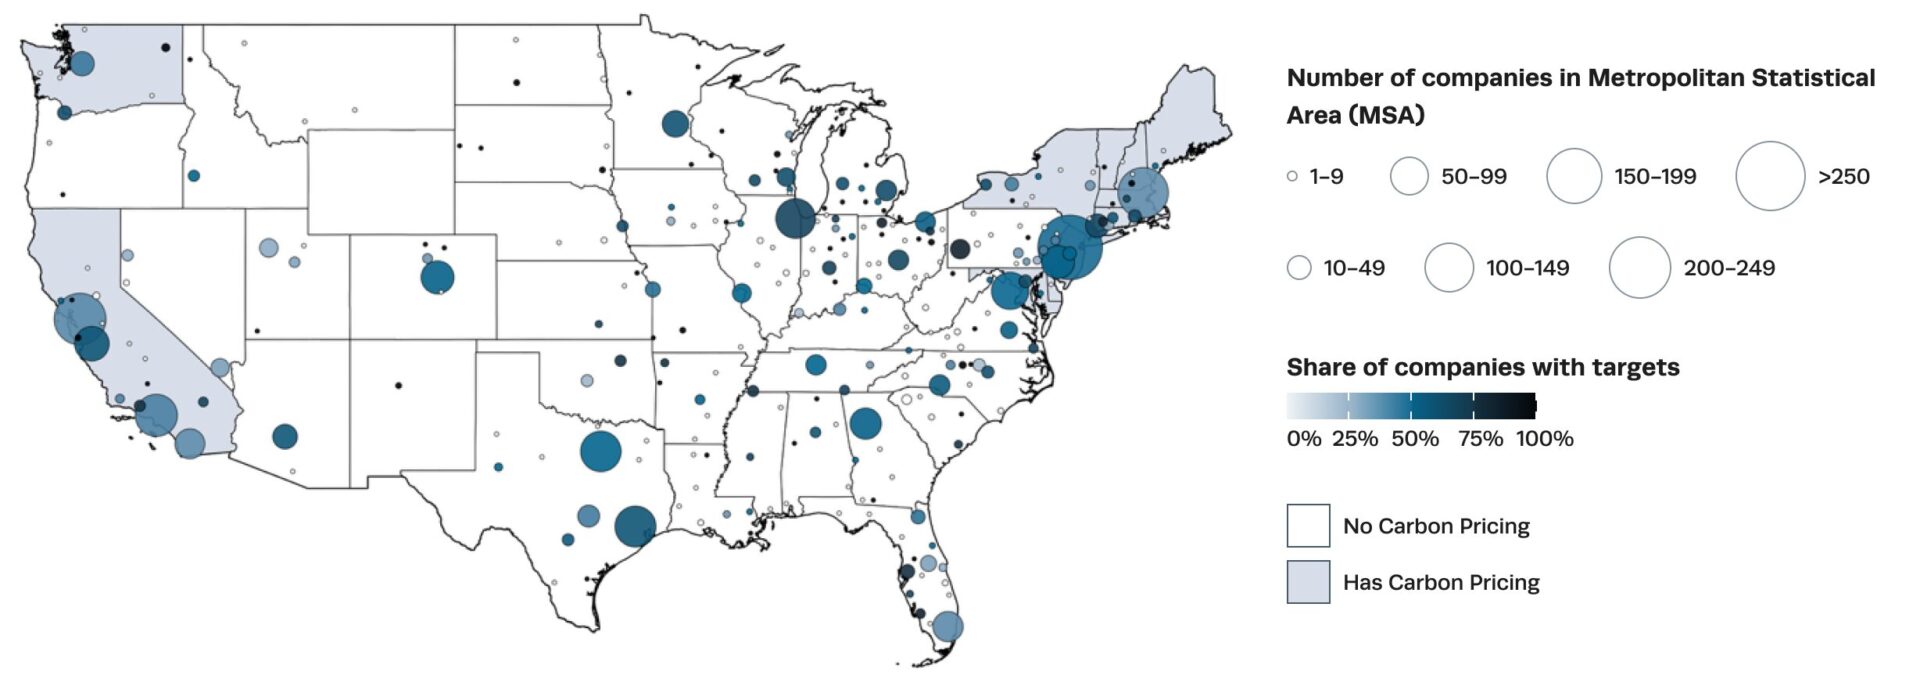
Bubbles by MSA (size = number of companies, color = share of companies with climate targets)
Sources: Salata Institute Corporate Climate Targets Database, 2026. U.S. State Carbon Pricing Policies, 2025,
https://www.c2es.org/document/us-state-carbon-pricing-policies/.
Note: Map excludes the 120 companies with HQ locations outside the continental United States.
Russell 3000 Company Headquarters by MSA and State Renewable Portfolio Standard (RPS), 2024
This map shows Russell 3000 company headquarters grouped by metropolitan statistical areas (MSA). Larger bubbles represent more companies headquartered in an MSA. Bubbles are shaded depending on the share of companies that reported climate targets, ranging from lightest (no companies in the MSA reported targets) to darkest (all companies in the MSA have targets).
States that have renewable portfolio standards (RPS) in 2024 are shaded; policy details differ by state.
States with an RPS require a specified percentage of a covered utility’s electricity to come from renewable sources by a certain date. Utilities can meet these targets by developing eligible clean energy sources or buying credits from other developers.
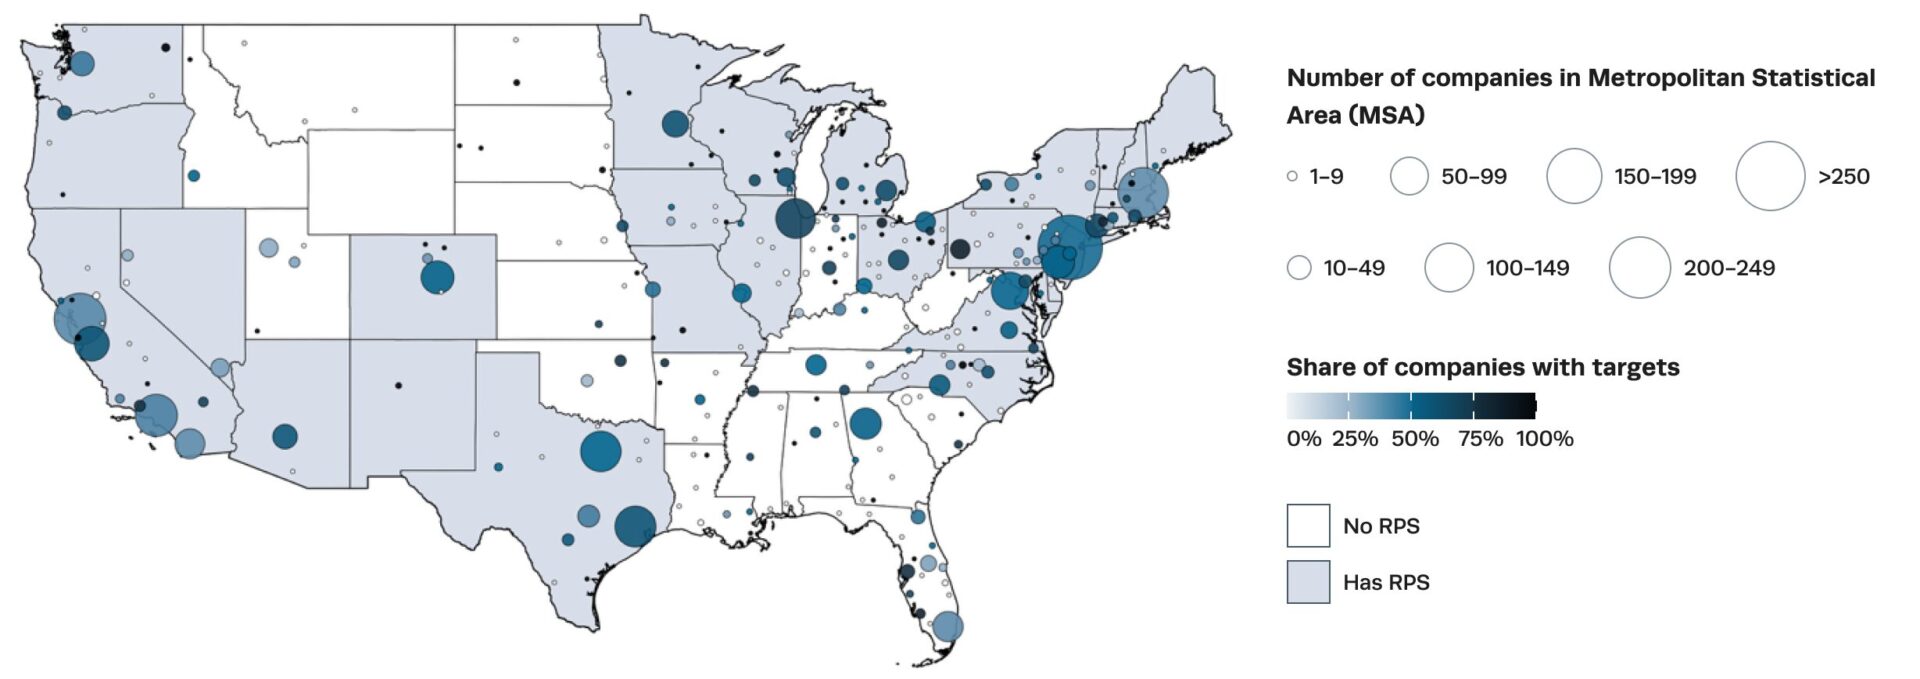
Bubbles by MSA (size = number of companies, color = share of companies with climate targets)
Sources: Salata Institute Corporate Climate Targets Database, 2026. State Electricity Resource Standards, 2026,
https://emp.Ibl.gov/projects/renewables-portfolio.
Note: Map excludes the 120 companies with HQ locations outside the continental United States.
Russell 3000 Company Headquarters by MSA and State GHG Goals, 2024
This map shows Russell 3000 company headquarters grouped by metropolitan statistical areas (MSA). Larger bubbles represent more companies headquartered in an MSA. Bubbles are shaded depending on the share of companies that reported climate targets, ranging from lightest (no companies in the MSA reported targets) to darkest (all companies in the MSA have targets).
States with statewide greenhouse gas emission targets as of 2024 are shaded; policy details vary by state.
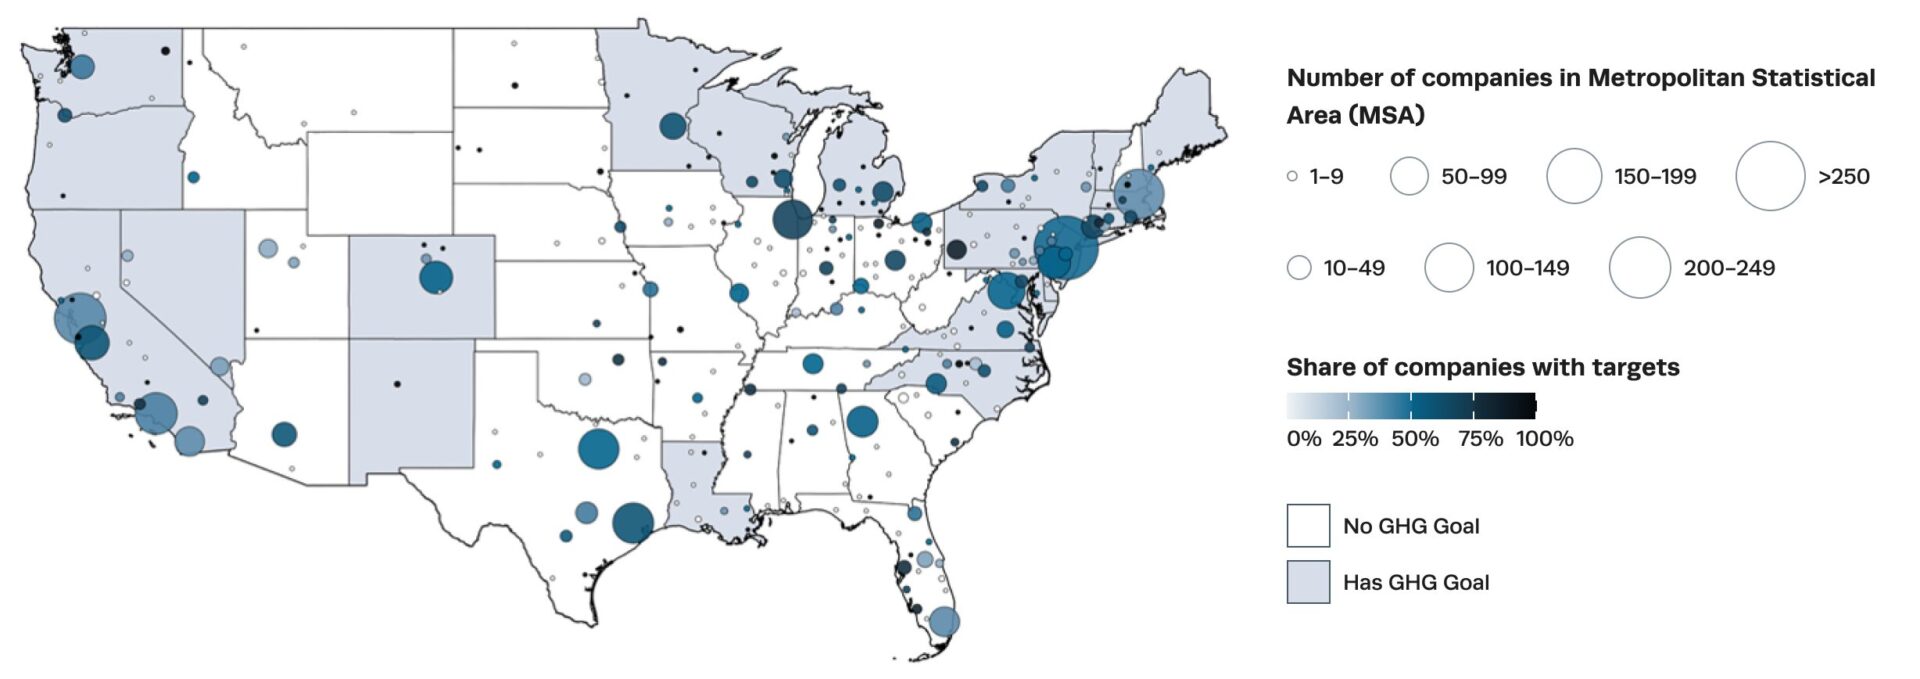
Bubbles by MSA (size = number of companies, color = share of companies with climate targets)
Sources: Salata Institute Corporate Climate Targets Database, 2026. U.S. State Greenhouse Gas Emissions Targets, 2025,
https://www.c2es.org/document/greenhouse-gas-emissions-targets/.
Note: Map excludes the 120 companies with HQ locations outside the continental United States.
Russell 3000 Company Headquarters by MSA and Environmental Attitudes by U.S. Congressional Districts, 2024
This map shows Russell 3000 company headquarters grouped by metropolitan statistical areas (MSA). Larger bubbles represent more companies headquartered in an MSA. Bubbles are shaded depending on the share of companies that reported climate targets, ranging from lightest (no companies in the MSA reported targets) to darkest (all companies in the MSA have targets).
Congressional districts are shaded if the majority of the population supported Federal regulation of greenhouse gas emissions.
The Cooperative Election Study (CCES) surveyed respondents to indicate whether they support or oppose the following statement: “Give the Environmental Protection Agency power to regulate carbon dioxide emissions.” These data were drawn from the 2024 survey, using Congressional districts from the 2024 election.
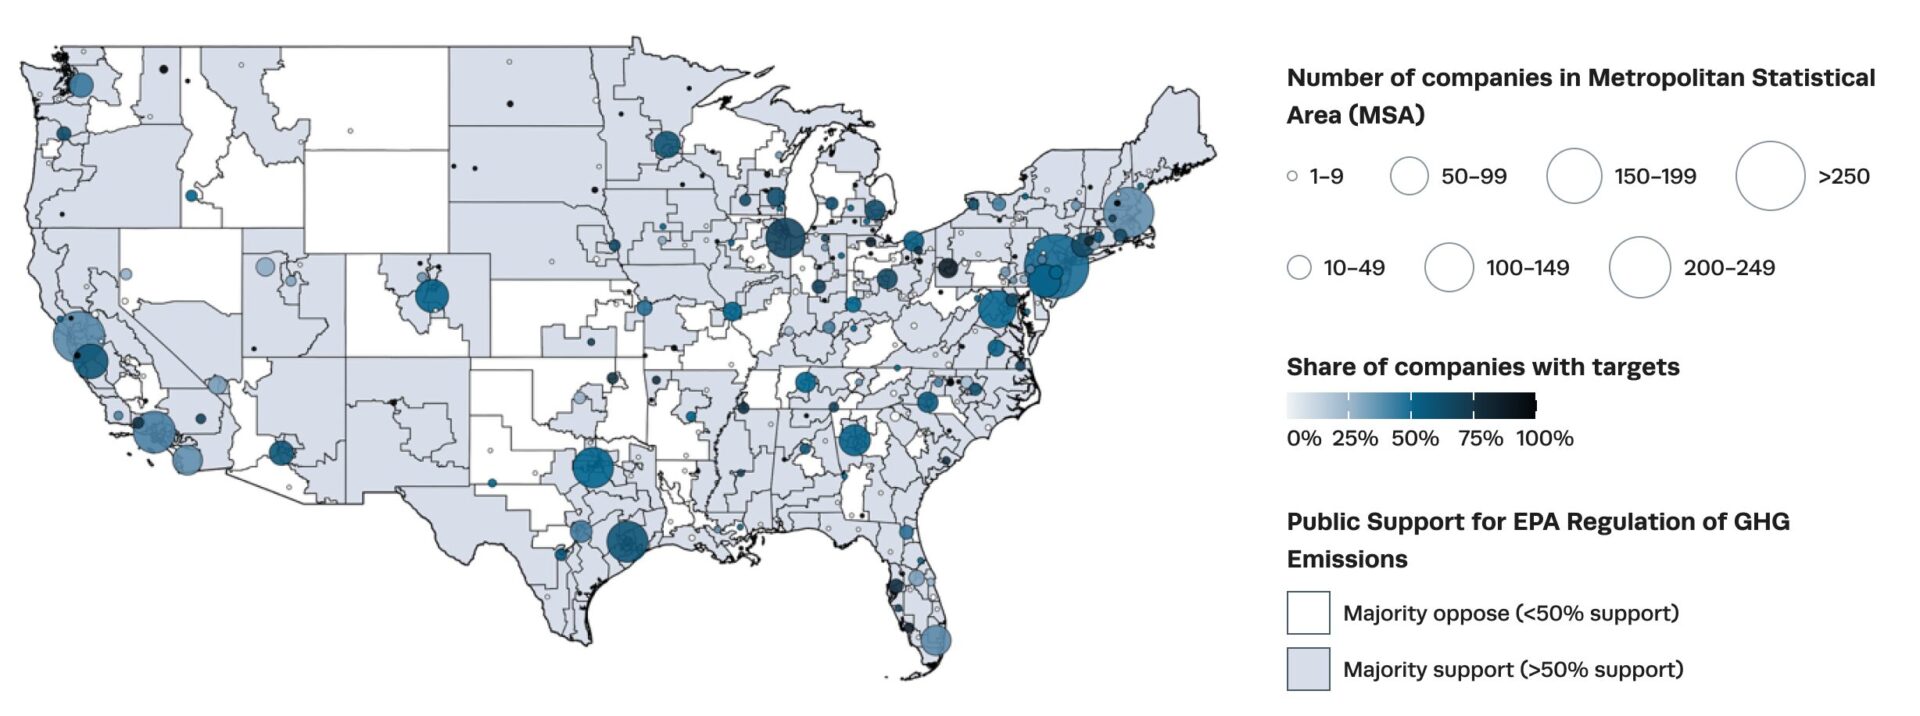
Bubbles by MSA (size = number of companies, color = share of companies with climate targets)
Sources: Salata Institute Corporate Climate Targets Database, 2026. Cooperative Election Study Common Content, 2024,
https://dataverse.harvard.edu/dataset.xhtml?persistentId=doi:10.7910/DVN/X11EP6.
Note: Map excludes the 120 companies with HQ locations outside the continental United States. We thank Stephen Ansolabehere and Dylan Carlson Sirvent León for their assistance in preparing the underlying data used in this figure. CES sampling weights were applied in the calculation of district-level support estimates to produce estimates representative of the survey population.
FAQ
Contact Us
The Corporate Climate Targets Project welcomes inquiries, feedback, and collaboration opportunities. Please use the form below, or reach us by email at salata_netzeroproject@harvard.edu
FAQ
This page contains answers to frequently asked questions about the Corporate Climate Targets Project and the Salata Institute Corporate Climate Targets Database. More details are provided in Methodology, Data Sources, and Classification Decisions linked on the Data and Papers tab. For any other questions, use the Contact Us form.
1. General information
The database covers all 2,986 companies that were listed in the Russell 3000 Index in June 2023. The Russell 3000 includes the largest 3,000 U.S. publicly traded companies and represents approximately 98% of the U.S. public equities by market capitalization. While the Russell 3000 is intended to include 3,000 companies, the actual number varies due to mergers, bankruptcies, acquisitions, and other factors. More information on the Russell 3000 Index is available via its fact sheet.
The database includes information on the companies’ voluntary climate targets collected by the Corporate Climate Targets Project, company and industry identifiers from multiple sources, and indexed carbon emissions data from Trucost Environmental (provided by S&P Global). A Harvard research team collected targets information exclusively from publicly available sources, including companies’ sustainability reports, annual reports, 10-K filings, press releases, and CDP survey responses published on the companies’ websites. The URLs of all sources are documented in the database, and PDF source files were archived.
The database covers climate targets announced from 2000 through 2024. The target years characterizing these climate targets span 2002 through 2060.
The database excludes environmental targets that are government-mandated, that do not relate to greenhouse gas emissions (e.g., water use, emissions or effluents of toxic or conventional pollutants), and that are commitments to deploy capital for sustainable finance.
This project was funded through a Research Cluster Grant from the Salata Institute for Climate and Sustainability at Harvard University. This website was partially funded by the Harvard Business School AI Institute’s Climate and Sustainability Impact Lab as well as by the CCTP cluster.
Similar projects and resources include the Science Based Targets initiative (SBTi), CDP’s Corporate Environmental Action Tracker, the Net Zero Tracker, the London School of Economics and Political Science’s Transition Pathway Initiative (TPI), and Climate Action 100+. The Corporate Climate Targets Project differs from these projects in that:
- all data were independently collected from publicly available documents published by the companies in the sample (e.g., 10-K filings, sustainability reports, corporate websites);
- the sample includes all members of the Russell 3000 Index as of June 2023, which includes the approximately 3,000 largest publicly traded companies listed on U.S. stock exchanges. The sample is thus not a function of survey response or commitments to specific types and/or ambition of targets;
- the database is structured to enable users to easily link the targets data to others’ databases that provide financial and emissions data; and
- the database is freely available for download.
2. Data collection and validation
A team of trained research assistants, overseen by the Principal Investigators, identified publicly-available company documents containing information about climate targets, and created database entries for each target-related statement, its source document URL, and archived corresponding PDF documents.
Database entries underwent three rounds of quality control. First, multiple groups of research assistants reviewing each target against the source documents to verify accuracy and consistency with the project’s data coding specifications. Data entries are derived from the details of targets disclosed in each company’s published documents, and corrections were made where discrepancies were found. The team also checked for overlooked public sources and added newly identified documents to the project’s repository. Second, the research team designed an independent large language model (LLM) to generate comparable data from public source documents, and research assistants compared its findings to the database to flag and resolve discrepancies. Third, research assistants emailed representatives of each company in the database to invite their feedback on the data collected pertaining to their company. Their feedback was then reviewed alongside the publicly available documents and, when appropriate, the research team made corrections and/or documented clarifications in the database’s notes field.
Yes. Data entries were cross-referenced with sources including CDP, SBTi, the Transition Pathway Initiative, Climate Action 100+, and other online compilations of voluntary emissions-reduction targets to identify any additional targets based on publicly-available source documents. In addition, while the research team used large language models (LLMs) to search business news media and related press releases for any emissions targets not already captured in the database, this did not uncover additional information. In addition, all companies were provided the opportunity to share feedback.
3. Variables and definitions
The database is structured so that an observation (a row) refers to a unique combination of company-activity year-target: one company’s specific target that was announced or maintained in a given activity year. Maintained means that the company publicly mentioned in the given year a target that it had initially announced in a prior year. For example, if a company first announced a specific target in a 2008 report and that same target was also mentioned in that company’s 2009, 2010, 2011, and 2012 reports, that target appears in the database in five rows, once for each of those reporting years.
A target appears in the database every year the company refers to it in its publicly-available document published. If a company mentions a target only the year it was announced, it will appear just once in the database. If another company mentions its target in the year it was announced and also the year after, the database will have two entries for that target, once for each of those years. A company might not mention an earlier target in subsequent years for many reasons, such as if the company achieved the target, abandoned it, or continued to strive to meet it but without mentioning it publicly, or if the company was acquired.
Each target is coded via 18 variables: reporting year; target type; commitment year; target year, target amount, and target unit; base year, base amount, and base unit; category (absolute or intensity); coverage (company-wide, subsidiary, or geographic area); chemical (e.g., carbon dioxide equivalent, methane, renewable energy); scope (e.g., Scope 1, Scope 1 and 2, etc.); achieved year; achieved year source; notes; the original text describing the target; and the source of that text (URL). Definitions of these variables are provided in the data dictionary found in the Data and Papers tab.
A voluntary climate target refers to a company’s voluntary pledge to reduce (mitigate) greenhouse gas emissions (GHG) associated with its activities. Targets are classified in several ways, including quantitative versus qualitative. Targets also include energy efficiency, renewable energy, and electrification commitments which would contribute to greenhouse gas emissions mitigation.
A quantitative target is a goal that seeks to reduce GHG emissions—or emissions-related activities such as energy use—resulting from a company’s operations, supply chain, and/or products. Also known as climate commitments or goals, these targets typically reference a baseline year, a target year, a reduction goal, and the scope of activities included. Such targets vary widely in scope, amount, format, and level of ambition. A company’s publicly available statement must meet the following conditions to be included as a quantitative target in the database:
- It must be forward looking;
- It contains sufficient detail to enable us to classify it as one of the following six quantitative target types: Net Zero, Absolute Zero, Carbon Neutrality, Climate Positive, GHG Reduction, Energy/Electrification (see next Q&A item for definitions);
- It specifies a target amount (in terms of either absolute GHG emissions or GHG intensity or relevant energy/electrification metric); and
- It includes a target year, which is when the company intends to achieve the target.
The database includes, when available, additional information such as base year, base amount, the year the commitment was issued (reporting year), and the target coverage that indicates whether a target refers to the entire company, a business segment, or a specific geographic area.
A qualitative target refers to a company’s non-quantitative commitment to reduce emissions, transition to lower-carbon operations, or stated intention to set a quantitative target in the future. Such statements might reference concepts such as decarbonization, net zero, climate ambition, or emission reduction goals, but they do not include sufficient information to be classified as a quantitative commitment. To be classified as a qualitative target, a statement must include three features:
- Relate to GHG/carbon emissions;
- Express an intention, ambition, or planned direction of action related to emissions reduction; and
- Lack a quantitative commitment.
Quantitative targets in the database do not include company statements referring to mechanisms, instruments, or strategies (e.g., to offset emissions via carbon credits).
The database classifies targets based on the terminology used by the company at the time of disclosure. Targets are classified into seven types:
- Net zero targets are commitments to achieve net-zero emissions, which commit a company to reduce most of their emissions while neutralizing the small remainder through offsetting via carbon credits and other greenhouse gas emissions avoidance or removal solutions.
- Carbon neutrality targets are commitments to become carbon neutral, which allow companies to rely on carbon credits that avoid or remove greenhouse gas emissions (e.g., reforestation), renewable energy credits, and carbon trading to balance emissions, focusing on compensation rather than elimination.
- Absolute zero targets are commitments to eliminate 100% GHG emissions without relying on carbon offset credits.
- Climate positive targets are commitments to go beyond eliminating 100% GHG emissions by ensuring the removal or avoidance of more emissions than the company generates through its operations.
- GHG reduction targets are commitments to reduce GHG emissions or emissions intensity by a certain amount or specified percentage of a base amount that do not explicitly refer to achieving net zero or carbon neutrality.
- Energy/electrification targets are non-GHG commitments that contribute to GHG reduction. Examples include commitments to engage in energy efficiency (reduce energy demand), promote zero- or low-carbon energy (e.g., renewables, sustainable aviation fuel), and electrify activities powered by fossil fuels in ways that contribute to GHG emission reduction (e.g., electrification of heat or vehicles). All energy/electrification targets qualify as quantitative targets unless they are missing a target amount or target year, in which case, they are coded as qualitative.
- Qualitative targets are non-quantitative commitments that express an intention to set emission-related targets in the future. These statements may reference concepts such as decarbonization, net zero, climate ambition, or emission reduction goals, but they do not include sufficient information to be classified as a quantitative commitment.
The lack of standardized language surrounding companies’ voluntary climate targets, along with ambiguity in some company statements in publicly available primary sources, creates many challenges in tracking climate targets. Energy/electrification targets and qualitative targets can contribute to reducing GHG emissions and are often motivated, at least in part, by climate-related objectives.
Database cells are coded as “Not Applicable” when there is no logical value for that variable given the target type in that row. Missing (blank) cells represent cases in which the research team could not find the information in public domain documentation.
In the context of sustainability and climate targets, companies tend to refer to hydrogen as part of their efforts to use “green hydrogen,” which is hydrogen produced through electrolysis powered by renewable electricity. The Corporate Climate Targets Project considers this a commitment to shift energy sources from fossil fuels to renewables.
Supplier emissions contribute to a company’s upstream Scope 3 emissions, and for many companies, far exceed the company’s Scope 1 and 2 emissions. Supplier-related (Scope 3) targets represent one way some companies seek to reduce these emissions.
Once companies are acquired, they cease to exist as an independent entity and no longer have entries under that company name in the database. When two companies in the database merge, data continues to be collected under the lead entity company name, the company under which operations continue, with notes in the records explaining the change for both companies. To track companies that have undergone name changes, both the prior and current names are recorded in a crosswalk in the database, along with the corresponding years each name was in use.
Science-Based Targets (SBTs) refer to company targets that have either been submitted to (but not yet approved) the Science-Based Targets initiative (SBTi) or have been approved by SBTi. The SBT status variable refers to the status of a company’s target in the SBT approval process described in the target statement: pending, approved, or unspecified when the status could not be determined. The Corporate Climate Targets Project sources this information from company materials and the SBTi website.
These distinctions are defined by the Greenhouse Gas (GHG) Protocol, an independent global standard-setting initiative (see the GHG Protocol’s FAQ page for more details). Scope 1 refers to GHG emissions from sources that are owned or controlled by the company. Scope 2 refers to GHG emissions resulting from the generation of various forms of energy—electricity, steam, heating, or cooling—that the company purchases to power its operations. Scope 3 emissions refer to many other sources of GHG emissions associated with a company and can be thought of as upstream activities (e.g., the production and shipping of procured raw materials and components), and downstream activities (e.g., the shipping, use, and disposal of the company’s products). For the Corporate Climate Targets Project, scope is coded as a binary concept: if a company publicly states that a target covers a certain scope’s emissions, whether all or just partially, that scope’s indicator is coded “YES.” For example, if a company says a target covers Scope 1 and Scope 2 emissions, but the target only covers emissions from some segments of its Scope 1 emissions, this record will be coded “YES” for both Scope 1 and Scope 2 indicators.
S&P Global Trucost graciously allowed the Corporate Climate Targets Project to generate and publish indexed values of Trucost’s company-wide annual GHG emission values, each of which is either a company-disclosed value or a Trucost estimate (see the next Q&A for more details). The research team generated emissions index values dividing a company’s annual emission value to its emissions in the 2023 reference year and multiplying the result by 100. Companies’ 2023 index value is thus 100. For Scope 2 emissions, the database uses location-based Scope 2 emissions, which are calculated based on the emission intensities of the relevant electricity grids where the electricity is consumed.
S&P Global Trucost collects emissions data from reported corporate disclosures, such as CDP and annual reports, but when those are unavailable for a company in a given year, Trucost uses a model to develop estimates. For more information, refer to S&P Global Trucost Environmental’s methodology.
4. Corrections and updates
The Corporate Climate Targets Project plans to issue database updates in the future. Please use the Contact Us form to describe how you would make use of updated data, which could help accelerate the updating process.
Feedback is welcomed to improve the accuracy and completeness of the database. Please submit your comments and proposed changes/updates via the Contact Us form.
5. Data access and citation
Users can freely access the Salata Institute Corporate Climate Targets Database here: https://dataverse.harvard.edu/dataverse/corporateclimatetargetsproject. You will be asked to provide your name, email, affiliation, intended use, and confirmation that you have read the terms of use.
Joseph Aldy, Michael Toffel, Ariane Bretl, Carissa Hanjani, Zhanbing Xiao, Lavender Yang (2026). Salata Institute Corporate Climate Targets Database. Harvard University. [https://doi.org/10.7910/DVN/0OYPRG]
Custom Dataset Terms – the following Custom Dataset Terms have been defined for this dataset.
Dual-Use License: CC BY 4.0 and CC BY-NC 4.0
CC BY 4.0 applies to the following variables: hastarget, text, reportyear, year, targettype, commitmentyear, targetyear, targetamount, unit, baseyear, baseamount, baseunit, chemical, category, coverage, scope1, scope2, scope3, scopeunspecified, is_sbt, sbt_status, achievedtargetyear, achievedtargetyear_source, note, sourceweblink, naics_code/industry, naics_title/industrytitle, ntarget, ntarget_sbt, ntarget_scope1, ntarget_scope2, ntarget_scope3, ntarget_scopeunspecified, ntarget_netzero, ntarget_ghgreduction, ntarget_carbonneutral, ntarget_absolutezero, ntarget_climatepositive, ntarget_group_ghg, ntarget_group_energy, ntarget_group_qualitative, and ntarget_unique.
Data under the CC BY 4.0 license can be shared, copied, or redistributed in any medium or format for any commercial or non-commercial purpose by the user. Users can also remix, transform, and build upon the material for any commercial or non-commercial purpose.
CC BY-NC 4.0 applies to the following variables in this dataset: cusip6, tru_ghg_s1_abs_idx, tru_ghg_s2_location_abs_idx, tru_ghg_s1_s2_abs_idx, tru_ghg_s1_abs_idx_noout, tru_ghg_s2_location_abs_idx_noout, tru_ghg_s1_s2_abs_idx_noout, tru_s1_source, tru_s2_source, tru_companyid, and target_id.
Data under the CC BY-NC 4.0 license can be shared, copied, or redistributed in any medium or format for strictly non-commercial, academic teaching, and research purposes. Users can also remix, transform, and build upon the material for strictly non-commercial, academic teaching, and research purposes. Users cannot use these data variables for commercial purposes. A commercial use is one primarily intended for commercial advantage or monetary compensation.
To the extent that certain individual data variables are not subject to copyright or other intellectual property protection, the CC BY 4.0 and the CC BY-NC 4.0 Licenses are not intended to imply the existence of rights where none exist.
The following variables in this dataset consist of factual information that may not, by itself, be protected by copyright or similar rights: firmname_year, firmname2023, firmname_latest, ticker, exchange, and hqlocation.
To access the data, users are required to accept these terms of use.
Under all terms, users must provide a link to the license, indicate if any changes were made, and give appropriate credit using the following citation:
Joseph Aldy, Michael Toffel, Ariane Bretl, Carissa Hanjani, Zhanbing Xiao, Lavender Yang (2026). Salata Institute Corporate Climate Targets Database. Harvard University. [https://doi.org/10.7910/DVN/0OYPRG].
About Us
The Corporate Climate Targets Project is produced by a multidisciplinary research team at Harvard University. For more information on this project and other related resources, please visit the research page here.
Principal Investigators
-

Teresa and John Heinz Professor of the Practice of Environmental Policy, Harvard Kennedy School
-

Archibald Cox Professor of Law, Harvard Law School
-

Executive Director of the Environmental & Energy Law Program, Harvard Law School
-

Senator John Heinz Professor of Environmental Management, Harvard Business School
Research Team
-

Research Assistant
-

Research Manager
-

Senior Staff Attorney, Harvard Law School
-

Staff Attorney, Harvard Law School
-

Postdoctoral Researcher
-

Postdoctoral Researcher (former)
-

Postdoctoral Researcher (former)
Associated Faculty and Fellows
-

Research Fellow, Harvard Kennedy School Mossavar-Rahmani Center for Business and Government; Assistant Professor, National University of Singapore
-

Assistant Professor of Business Administration, Harvard Business School
Thank you to the following individuals who also contributed to this project:
- Valerie Rose Aguilar
- Sami Almutairi
- Alexandra Lastra Andrade
- Tasneem Bhagat
- Gulzhahan Bissembayeva
- Satya Bodasingu
- Nanda Dara
- Vibhi Dixit
- Ganesh Kukreja
- Rebecca Lin
- Felix Lindenberg
- Alec Madaus
- Arjun Malarmannan
- Gabriel Moberg
- Sameer Younus Mohammed
- Pruthvi Kashyap Mohan
- Melissa Ouellet
- Nikitha Sree Pediredla
- Ratul Rana
- Evan Redd
- Daniela Schulman
- Fernando Serrano
- Aman Shaikh
- Ayush Singh
- Justin Sturm
- Erich Trieschman
- Viktoria von Waldenfels
- Emma Walter
- Beining Wang
- Siva Yandrapu
- Oliver York
- Irfan Yousuf
- Angela Zhong
Contact Us
The Corporate Climate Targets Project welcomes inquiries, feedback, and collaboration opportunities. Please use the form below, or reach us by email at salata_netzeroproject@harvard.edu
Data and Papers
Data and Papers
For more information on this project and other related resources, please visit the research page here.
-
Salata Institute Corporate Climate Targets Database: An Overview
The White Paper provides an overview of the Corporate Climate Target database, including the data structure, target characteristics, and key descriptive statistics. It also details how the dataset was constructed, outlines the framework used to classify targets, and describes the data collection process.
-
Salata Institute Corporate Climate Targets Database: Full Database
This database provides data at target-company-year level on all voluntary targets data we collected from 2000-2024. It also includes company and industry identifiers from multiple sources and indexed emissions data from Trucost (S&P Global).
-
Salata Institute Corporate Climate Targets Database: Aggregated Database
This database provides data at company-year level on the number of active targets per company by target types and indexed emissions data from Trucost (S&P Global) between 2000-2024. It also includes companies' historical names, headquarter locations, and company and industry identifiers from multiple sources.
-
Data Dictionaries
This spreadsheet lists and defines every variable in our database and includes separate tabs for the two dataset levels: target-company-year and company-year.
-
Supplementary Coding Guidelines
The Supplementary Coding Guidelines details the codebook used to apply the classification framework during data collection and serves as a companion to the White Paper.