How we came to understand El Niño
Here is a puzzle. What single phenomenon connects three things that once seemed to have nothing to do with one another: a hazy star cluster over the Andes, a failed monsoon in India, and warm water off the coast of Peru? For generations, they were separate clues, divided by continents and oceans. But now we know they were signs of the same climate pattern.
For centuries, before anyone had a satellite, farmers in the high Andes forecast the coming year’s rainfall by looking at the brightness of a cluster of stars. In the altiplano of Peru and Bolivia, they climbed to the peaks before dawn around the June solstice and looked at the Pleiades, the small cluster the Greeks called the Seven Sisters. They judged how bright and how sharp it appeared. In some years the cluster was brilliant and clear. In others it looked dim and hazy. When it looked dim, they expected the rains to come late and thin, and they delayed planting their potatoes.
The next piece comes from the other side of the Earth, and it began with a famine. When the Indian monsoon failed in 1877, millions died and the government wanted future monsoons predicted. In 1904 the task fell to Gilbert Walker, a Cambridge mathematician with no training in weather, hired because he was good with numbers. Walker had Indian clerks compute correlations between weather records around the world. Out of that arithmetic came a pattern. Pressure across the tropical Pacific behaves like a seesaw: When it runs high near Tahiti, in the central Pacific, it runs low near Darwin, Australia.
The third piece: In 1892 a Peruvian naval captain, Camilo Carrillo, brought before the Geographical Society of Lima what fishermen had known for generations — that in some years the sea turned unusually warm around Christmas. The cold upwelling that fed the anchovy shut down, and the fish vanished.
For a long time these facts were dismissed as superstition or coincidence, or simply forgotten.
Jacob Bjerknes put them together. The International Geophysical Year of 1957–58 brought the first coordinated global observations across the Pacific, and Bjerknes saw that the three were aspects of one phenomenon: the high clouds that veil the stars over the Andes, Walker’s atmospheric seesaw, and the Peruvian fishermen’s warm water. The fishermen had called the ocean’s warming El Niño, after the Christ child, because it arrived near Christmas. Walker had called the atmospheric variability the Southern Oscillation. The climate community now joins the two as ENSO, the El Niño–Southern Oscillation, a phenomenon generated by the interactions between the ocean and atmosphere.
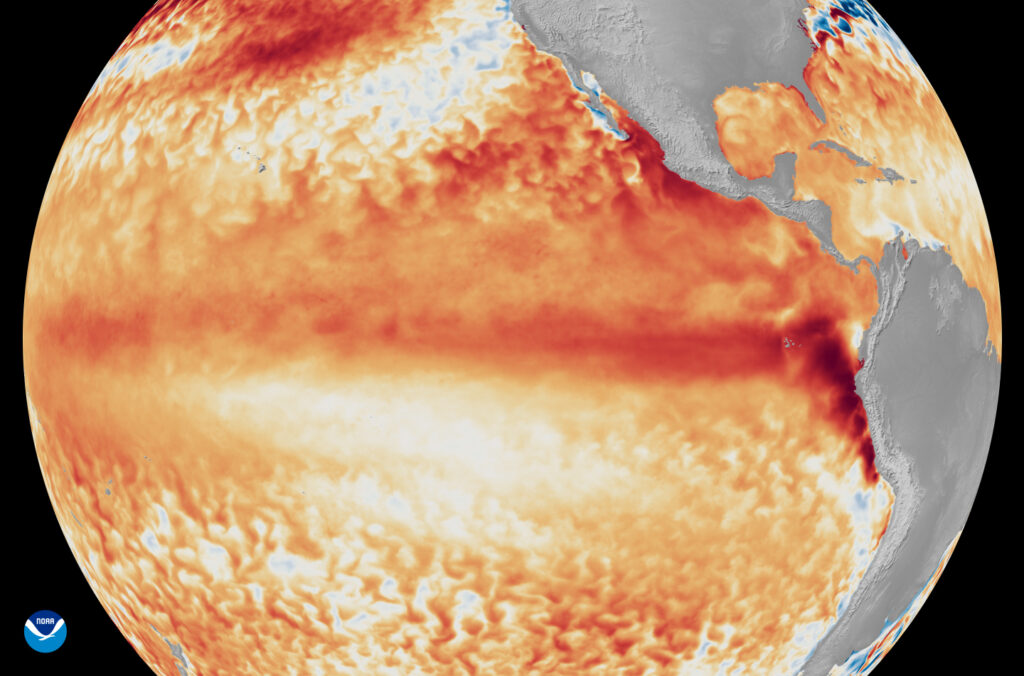
Under normal conditions, the trade winds blow from east to west across the Pacific, piling warm water near Indonesia and allowing cold, nutrient-rich water to rise along the coast of Peru. The warm water helps drive atmospheric circulation, which completes a loop with descending air converging over the eastern tropical Pacific. The temperature pattern sustains the circulation, and the circulation sustains the temperature pattern.
Sometimes this self-reinforcing cycle breaks down, and the warm water spreads east. The breakdown produces all three of our historical clues at once.
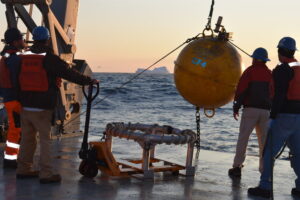
With high confidence, we are heading into a major El Niño in the coming months. This time the forecast does not come from the Pleiades. It comes from observations of Pacific temperatures and winds combined with climate models. An El Niño will bring the changes I have described, and others.
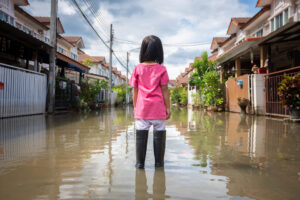
It typically dries Australia, Indonesia, southern Africa, and Central America, and it weakens the South Asian monsoon. It brings heavier rain to the Horn of Africa, southern South America, and the southern United States, and flooding to coastal Peru. It even reshuffles the storm map: a quieter Atlantic hurricane season and a more active Pacific.
To make things even more complicated, the remote effects of El Niño on temperature and rainfall are themselves changing as the climate warms. The atmospheric waves that carry El Niño’s influence to distant regions bend differently on a warmer planet, so the pattern of temperature and rainfall this time will not necessarily match past outcomes.
At the global level, El Niño is likely to make 2026 one of the warmest on record, and 2027 may be record-setting hot. El Niño typically peaks in the tropical Pacific in December through February, and global temperatures peak a few months later because of the time it takes for heat to accumulate elsewhere on the planet. Greenhouse-gas warming trends remain the main story, with El Niño temporarily adding to this trend. In sum, it looks like we are in for record global temperatures with novel local El Niño effects.
Now that we can see how the pieces fit together – and how climate change and El Niño interact – the question becomes what ought we to do? That puzzle remains to be solved.
All perspectives expressed in the Harvard Climate Brief are those of the authors and not of Harvard University or the Salata Institute for Climate and Sustainability. Any errors are the authors’ own. The Harvard Climate Brief is edited by an interdisciplinary team of Harvard faculty.