

How Harvard students measure a changing climate
A river that can turn poisonous in late summer. Migration records that stop at national borders. A trove of location data almost too large to use. Oak leaves, dried and pressed years ago, still holding clues to how plants respond to heat and rain.
These were among the challenges 11 Harvard students took on during eight weeks of summer research, which they presented at a recent poster session. Supported by the Salata Institute’s Summer Research Funding Program and conducted as part of the Harvard Summer Undergraduate Research Village, their projects examined climate change from different angles, including public health, human movement, and plant biology.
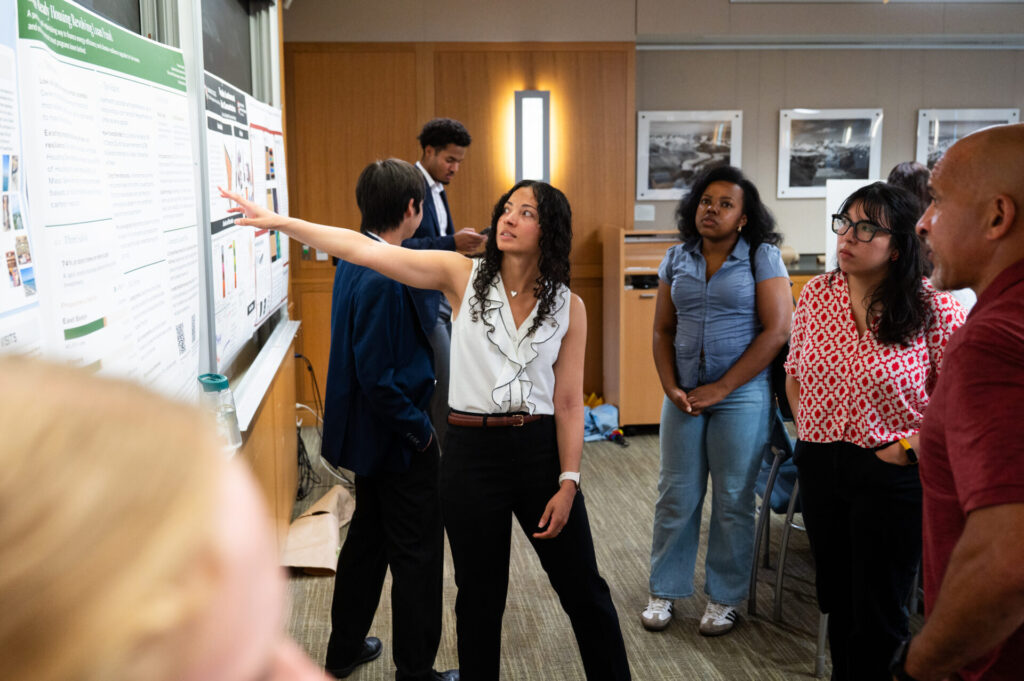
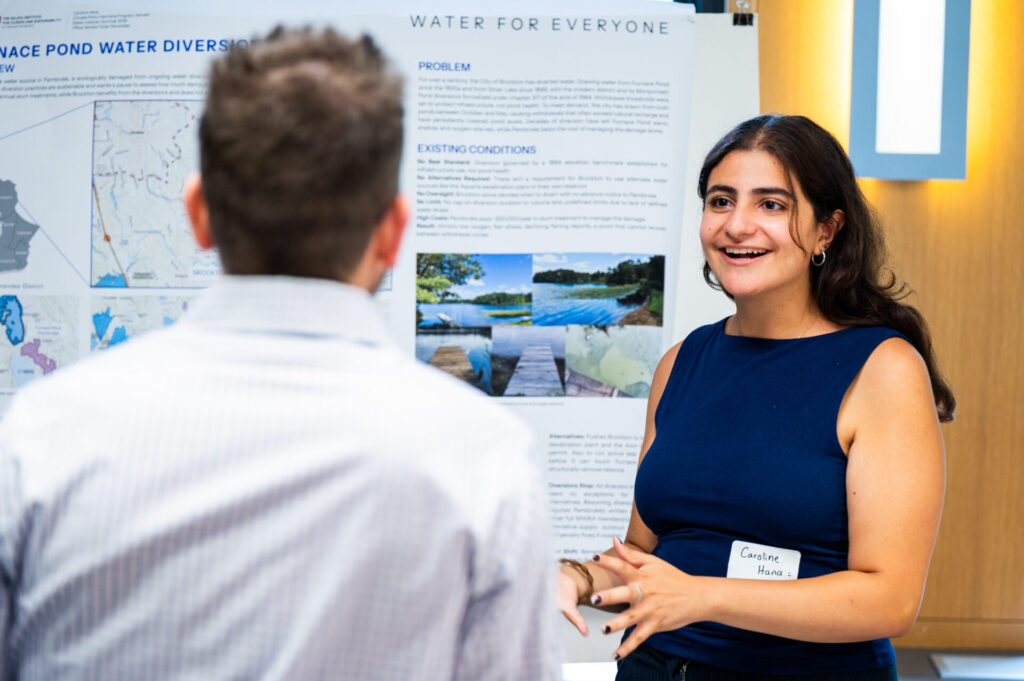
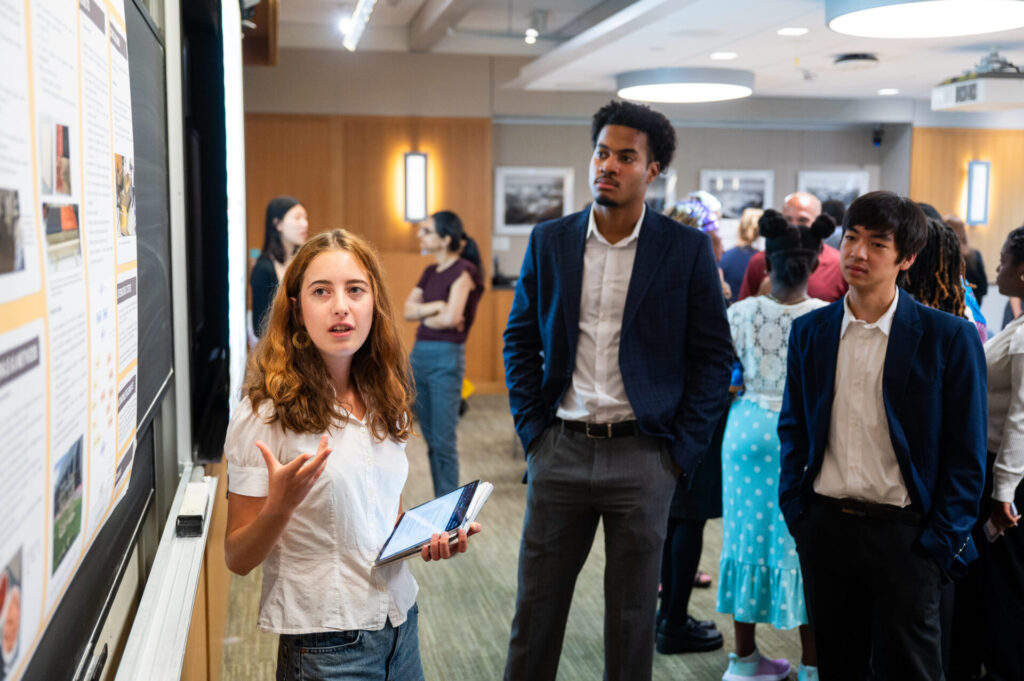
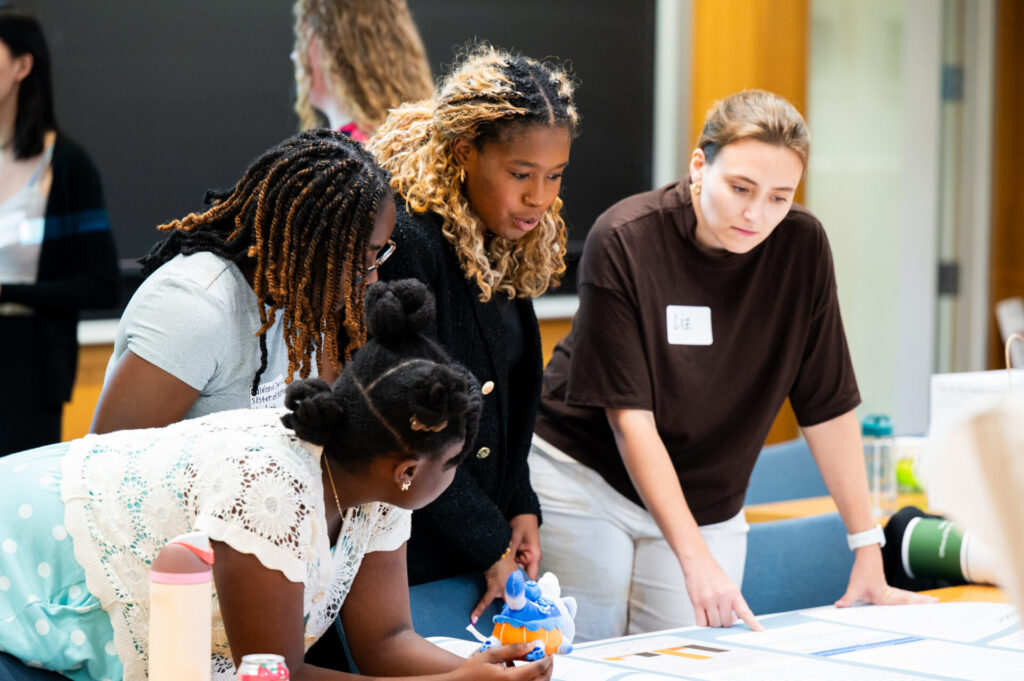
Each project posed a different version of the same broader question: How can researchers better understand the effects of a changing climate? These profiles introduce four of the students and the questions they set out to answer.
Annabelle Rayson – Water quality
Abdullah Shahid Sial – Fleeing climate disasters
Diana Nichvoloda – Parsing migration data
Elisabeth Stevens – Establishing relationships between plant traits and climate
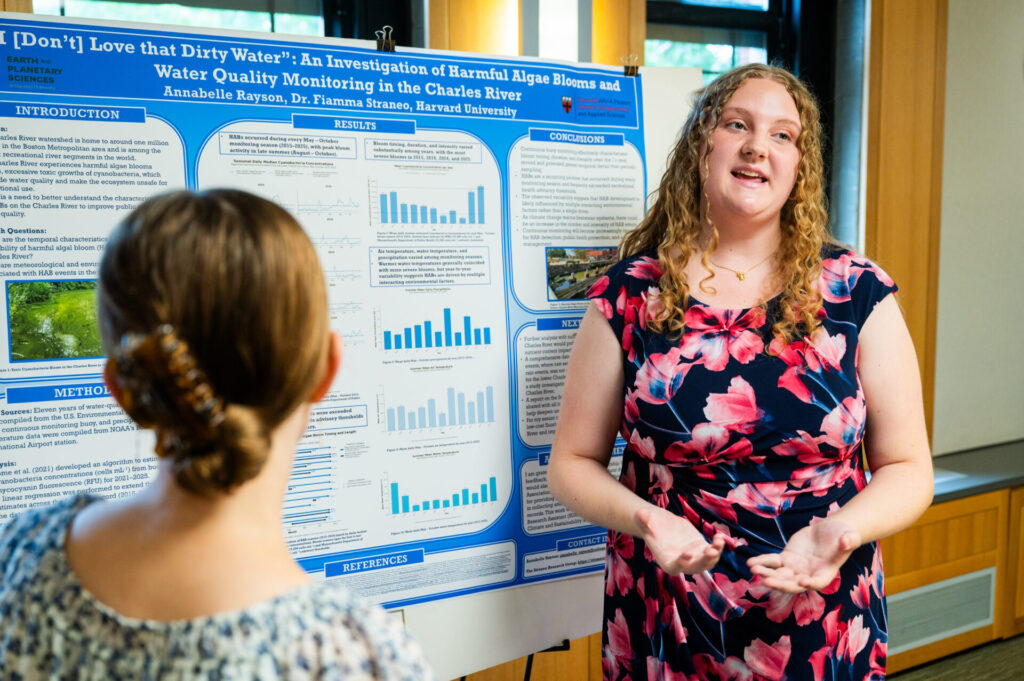
Annabelle Rayson is cautious when asked if she would swim in the Charles River. First, the concentration of cyanobacteria would need to be below 20,000 cells per milliliter, she insists. It could not have rained heavily in the preceding seven days. And she would still want to check the river’s E. coli levels.
Rayson, a rising senior studying Environmental Science and Engineering, spent the summer working with her advisor, Fiamma Straneo, examining 11 years of data on harmful algal blooms (HABs) in the Charles, which forms the boundary between Boston and Cambridge. She drew on readings from an Environmental Protection Agency monitoring buoy, as well as water samples and records collected by local advocates, to study when blooms appeared, how long they lasted, and what climate conditions may have precipitated them.
The project grew out of an interest that began well before Harvard. Rayson was raised on Lake Huron in Ontario, Canada, where her father is a commercial fisherman. Clean water was fundamental to her family’s daily life.
“I grew up with a deep love and appreciation for the water systems around me,” she said. Some summers, “harmful algae blooms made the water unsafe to drink or swim in and killed all the fish. This decimated the health, safety, and economies of local communities and created mass distrust in water resources.”
At Harvard, Rayson gravitated toward freshwater science – limnology – and the impact of climate change.
“I wanted to do something where I could apply my water science knowledge and better learn about the Charles, the ecosystem I live near,” she said.
While local government agencies have made great progress protecting the river from industrial pollution in recent years, climate change is contributing to factors that cause the harmful blooms. They occurred in every monitoring season Rayson analyzed, though their timing, duration, and intensity varied. They tended to be most persistent from August through October, she found, when warm water, high nutrient levels, and drought can help microscopic bacteria spread.
Rain is another problem. During heavy downpours – which are increasingly common with climate change – Boston’s aging combined sewer system can send raw sewage into the river instead of carrying it to a treatment plant. That is why Rayson would wait after a heavy rain, even if the cyanobacteria count looked acceptable.
For her senior capstone project, Rayson plans to build a low-cost fluorometer to help detect harmful blooms and protect public health. Better monitoring will help people know when it is safe to get into the Charles and when they should stay out.
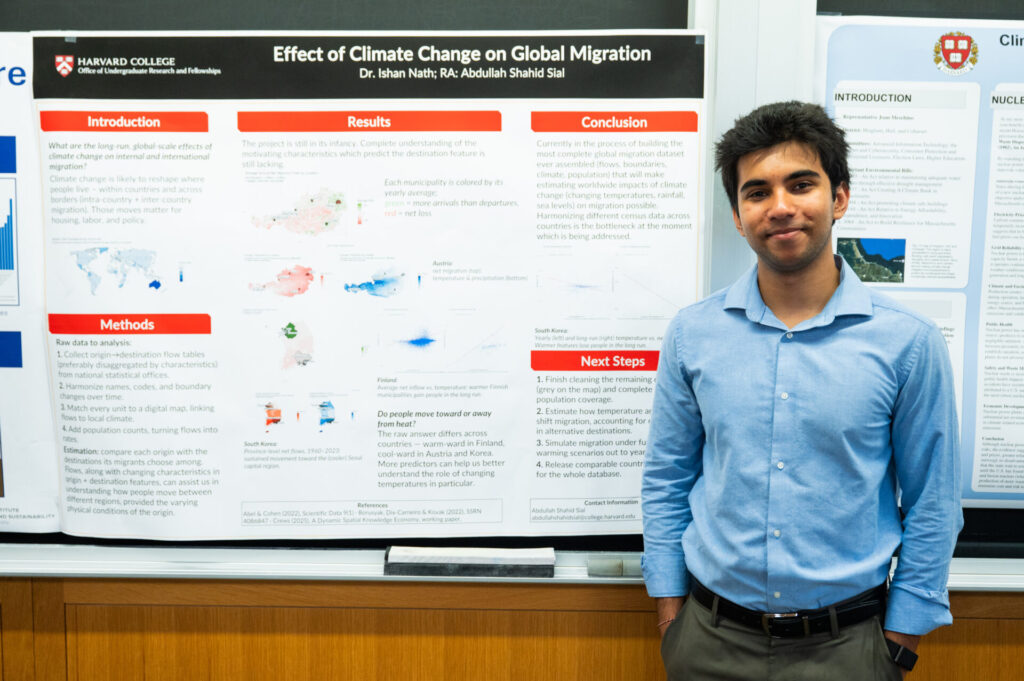
Abdullah Shahid Sial came to research climate migration because of what he saw in a place he knows well. Growing up in Pakistan, he spent his summers hiking in the country’s north, in regions like Gilgit-Baltistan, where he often witnessed extensive damage from extreme floods: homes destroyed, residents displaced. When Ishan Nath had an opening on his team studying how people move after floods and other climate-linked disasters, Sial explained why the work mattered to him. “That’s a place I hold very dear to my heart,” said Sial, a rising senior studying Economics and Mathematics.
The team is trying to build a detailed global record of where people move, when they move, and where they came from. The goal is to connect those patterns with changes in temperature, rainfall and sea level, and eventually learn how the changing global climate is shaping migration.
But first it must find and clean the data. That is especially difficult in countries where migration records may be incomplete or too broad to show both a person’s origin and destination. The countries with the best records are often wealthier and less exposed to climate change than the places the researchers most want to understand, Sial explained: Some records may track only where people move to, not where they left.
“That’s the bottleneck we have to overcome,” said Sial, who expects to continue working on the project during his senior year.
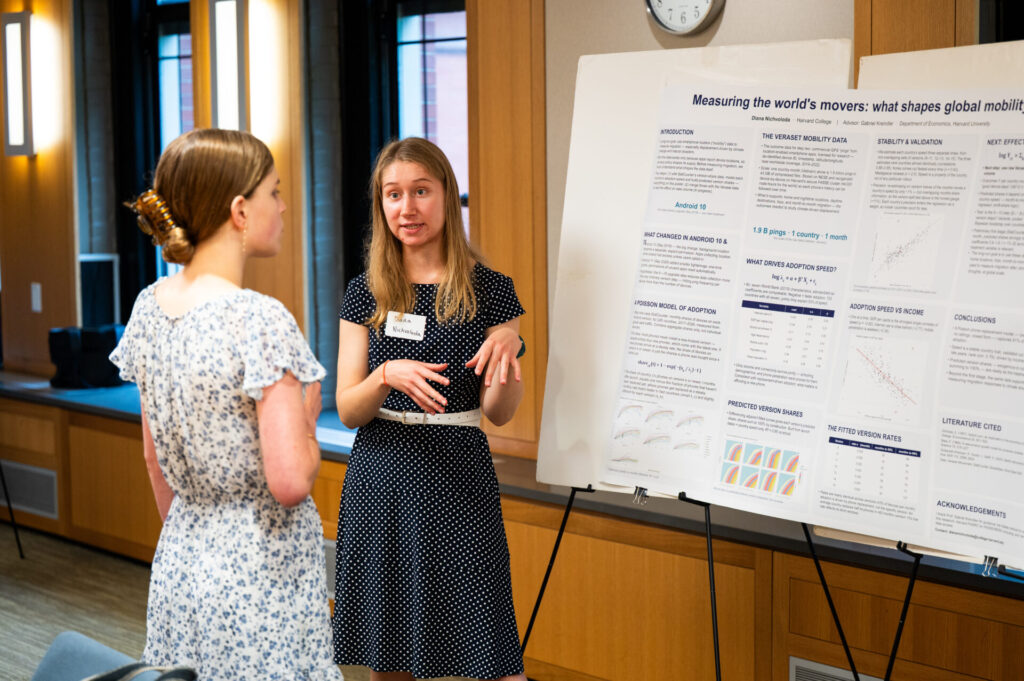
Diana Nichvoloda worked on a mirror problem: Sometimes there is too much data. The rising senior studying Economics and Philosophy spent much of the summer turning a vast trove of smartphone-location records into something researchers could actually use. The Veraset Movement dataset contains de-identified location data from smartphones around the world, purchased by the Salata Institute and other Harvard groups for research on mobility, climate change, and related topics.
Nichvoloda is part of a team led by Gabriel Kreindler that eventually hopes to examine whether people move after climate shocks by tracking anonymized devices and distinguishing short trips from lasting moves. First the records must be sorted, compressed, and checked for bias.
“When I got here, my mentor, Professor Kreindler, said that to process and sort all of it would take about 100 days of the computer running consistently,” she recalled.
Nichvoloda built a pipeline that organized observations and compressed the files. She also tested whether a change to Android’s privacy settings altered who appeared in the data. To do that, she modeled how quickly countries adopted new Android versions, then used regression analysis to see what explained faster adoption. Internet access and national income mattered most; education, population, and age did not.
The migration study comes later. For now, Nichvoloda said, basic question is whether the dataset can support it.
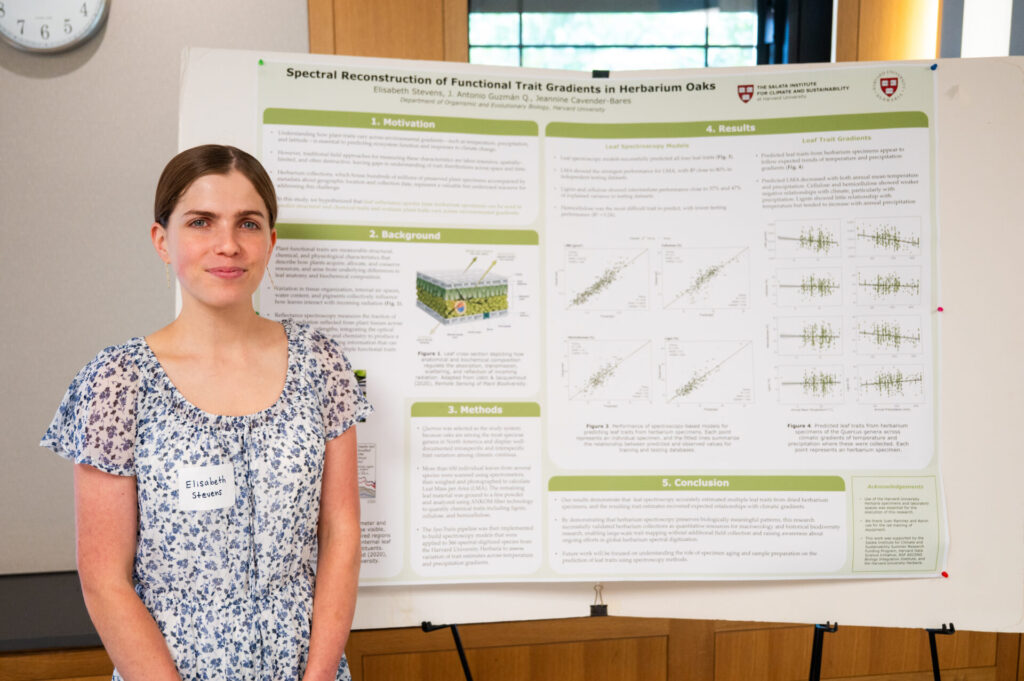
Elisabeth Stevens spent the summer looking for information hidden in dried oak leaves. Stevens, a rising junior studying Integrative Biology and Environmental Science and Engineering, worked with specimens in the Harvard University Herbaria. Each of these plants – collected over decades, then pressed, dried, and preserved – retains a record of when and where it was found, but measuring its chemical and structural traits often means grinding up the leaf and destroying the specimen.
Herbaria, Stevens said, are “a vastly underutilized resource,” holding millions of specimens with information about where and when they were collected.
Working with the director of the Herbaria, Jeannine Cavender-Bares, and research scientist Antonio Guzmán, Stevens tested whether spectroscopy could offer a less destructive approach. She scanned hundreds of oak leaves with instruments that measure reflected light, then measured traits including leaf mass and levels of lignin, cellulose, and hemicellulose. Because a leaf’s internal structure and chemistry affect how it reflects light, she said, “the unique shape of a spectrum can give information about the interior organization” of the leaf.
Stevens used the paired measurements to build a model that estimated traits in other specimens from their spectra alone. She then compared those estimates with temperature and precipitation data from the places where the leaves had been collected, establishing relationships between plant traits and climate.
“In the long term,” she said, “understanding plant traits will affect how we understand plants and how they respond to climate change.”
To stay up to date on opportunities for Harvard University students interested in climate and sustainability, subscribe to the Salata Institute student newsletter!